
How Schools Can Measure Inclusion Beyond Test Scores
Understanding how schools can measure inclusion beyond test scores requires us to step away from spreadsheet metrics and look directly into the rhythm of an ordinary Tuesday morning in a seventh-grade classroom.
A student who uses a non-verbal communication device sits near the front of the room.
On paper, her attendance is registered, her standardized evaluation profiles are updated, and her individualized education program (IEP) forms are neatly archived in the district database.
But as the teacher asks the class to pair up for a history project, a subtle pause settles over the room.
Eyes shift, students glance at their habitual partners, and for a long ten seconds, she remains floating in a micro-vacuum of social uncertainty before the teacher gently intervenes to assign a partner.
That brief, quiet pause represents a dimension of school life that no end-of-year assessment ever captures.
For decades, educational institutions have relied almost exclusively on standardized testing and formal academic metrics to gauge educational progress and institutional equity.
Yet, true inclusion is an ongoing social, cultural, and relational reality that unfolds in hallways, cafeterias, group projects, and extracurricular clubs.
When we rely solely on numerical academic benchmarks, we miss the exact mechanisms that determine whether a child feels like an active member of a community or merely a physical presence accommodated by law.
Key Dimensions of Inclusive Assessment
- Relational Belonging: Tracking peer dynamics, reciprocal invitations, and informal social integration during non-structured school hours.
- Institutional Accessibility: Evaluating physical autonomy, intuitive navigation, and adaptive learning environments.
- Systemic Student Agency: Measuring self-advocacy opportunities, choices in expression, and student participation in institutional governance.
- Longitudinal Equity: Observing long-term engagement, transition outcomes, and multi-year community retention patterns.
Why Do Traditional School Metrics Fail Disabled Students?

The historical reliance on standardized testing stems from an administrative desire for comparability. Systems crave uniform metrics because they make large-scale governance manageable.
However, this framework treats education as a linear assembly line where inputs equal outputs.
What rarely enters this debate is how standardized testing culture inherently measures conformity rather than genuine engagement or growth.
When a school district evaluates its diversity and inclusion success, it typically counts headcounts, physical accommodations, and test pass rates.
But a student can score well on an exam while remaining completely isolated from the social fabric of the school community.
Conversely, a student making immense strides in communication, autonomy, and collaborative problem-solving might show modest gains on a standardized scale.
By elevating test scores as the sole barometer of achievement, educational institutions risk mistaking access for belonging.
When we observe with more attention, the pattern repeats across public and private systems alike.
We build accessible ramps at the front entrance, install automatic doors, and issue compliance reports, yet the internal social systems remain rigid.
True educational inclusion demands an evaluation model that values human connection and personal growth as rigorously as academic performance.
How Can Educators Evaluate Daily Social Integration?
To understand how schools can measure inclusion beyond test scores, administrators must learn to observe the qualitative ecosystem of the school environment.
Social integration does not happen automatically just because students occupy the same room. It is built through small, daily interactions that reflect peer culture and institutional culture.
++ Preparing Disabled Students for Career Success Before Graduation
Observing Informal Spaces
The cafeteria, playground, and hallways offer clearer pictures of inclusion than structured instruction time.
Are disabled students sitting together in segregated clusters out of habit or convenience, or are lunch tables naturally integrated?
Are games during recess adapted spontaneously by students themselves, or do disabled peers remain spectators?
Tracking these informal patterns through qualitative observational protocols provides actionable data on social health.
Also read: Inclusive Education in the Middle East: Emerging Opportunities
Measuring Peer Collaboration
In group learning settings, educators can monitor how tasks are distributed. Are disabled students given meaningful, analytical roles, or are they consistently assigned passive tasks?
Analyzing group dynamics reveals whether peers view each other as valuable contributors or merely as participants in a teacher-mandated exercise.
Há um detalhe estrutural que costuma ser ignorado: true social inclusion requires peer empathy, not just tolerance.
Schools that succeed in this area actively collect feedback from all students regarding classroom culture, empathy levels, and perceived safety, turning subjective social experiences into actionable qualitative metrics.
Read more: Africa’s Innovative Approaches to Inclusive Learning
What Does Genuine Student Agency Look Like in the Classroom?
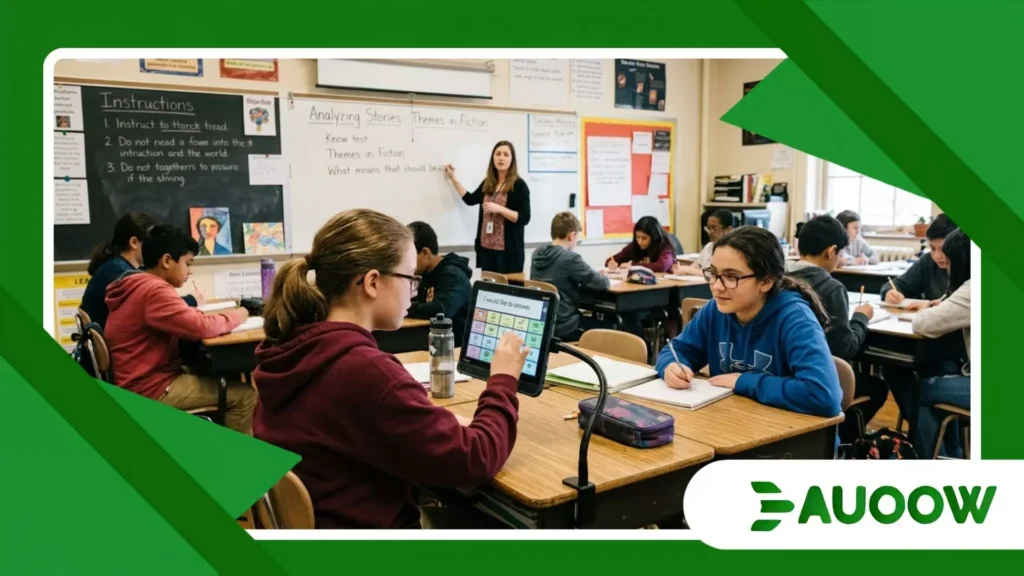
A school environment can be fully compliant with accessibility laws while remaining deeply disempowering.
Genuine inclusion requires giving students agency over their learning paths, communication tools, and physical surroundings.
In my reading of this scenario, agency is the clearest indicator of institutional maturity.
When a school measures inclusion effectively, it evaluates how often students are invited to co-design their accommodations rather than having solutions imposed upon them from above.
Pense em um trabalhador qualificado enfrentando barreiras que não aparecem nos regulamentos that path of institutional friction begins years earlier in primary and secondary classrooms.
When a student with motor disabilities or neurodivergent processing is given the freedom to choose how they demonstrate mastery whether through audio essays, visual diagrams, or oral presentations the focus shifts from proving compliance to cultivating individual talent.
Tracking agency involves auditing classroom choices:
- How many evaluation formats are offered for a single assignment?
- How easily can a student request modifications without bureaucratic delay?
- Are students trained to articulate their own learning preferences?
When institutions measure these factors, they move beyond rigid testing frameworks toward true empowerment.
How Do Structural Policy Choices Shape Classroom Realities?
To understand current educational challenges, we must look at how past policies shaped our present metrics.
The late 20th century saw massive legislative victories in civil rights and disability access, such as the Individuals with Disabilities Education Act (IDEA) in the United States and similar frameworks across Europe and Latin America.
These laws focused primarily on access, integration, and individual accommodations.
However, the simultaneous rise of high-stakes testing regimes in the early 2000s created a structural contradiction.
On one hand, schools were mandated to include all learners; on the other hand, schools were judged, funded, and ranked based on standardized output measures.
This tension forced many schools to treat inclusion as a compliance checklist designed to avoid legal risk rather than a holistic educational philosophy.
The analysis most honest suggests that this historical tension remains active today.
When test performance determines institutional funding and reputation, educators face immense pressure to prioritize test preparation over relational, experiential learning.
Rebalancing these priorities requires a systemic shift in how educational leaders define, record, and reward progress.
Exploring practical frameworks demonstrates how schools can measure inclusion beyond test scores in ways that are both rigorous and manageable for teaching staff.
| Metric Domain | Traditional Benchmark | Holistic Inclusion Benchmark | Data Collection Method |
| Social Connection | Attendance rate in main classroom | Peer interaction frequency & recess integration | Structured observational rubrics & student surveys |
| Academic Agency | Standardized test score percentile | Student-led goal setting & choice in assessment formats | Portfolio reviews & self-advocacy tracking |
| Environmental Access | Facility compliance with physical codes | Autonomous mobility & friction-free tool access | Student mobility audits & daily barrier logs |
| Institutional Culture | Number of diversity training hours | Student-reported sense of safety and belonging | Anonymous climate surveys & focus groups |
What Does an Inclusive School Look Like in Practice?
Consider the case of a middle school in Western Europe that decided to overhaul its evaluation strategy.
Rather than evaluating inclusion through annual exam results and legal compliance audits, the school implemented a bi-weekly “Belonging Index.”
This index used brief, three-minute digital check-ins where students answered reflective questions about their daily experience:
- Did you feel listened to by your peers today?
- Did you have access to the learning tools you needed without feeling singled out?
- Were you able to contribute meaningfully to group work?
The results transformed the administrative perspective. The school discovered that while physical accommodations were technically compliant, neurodivergent students were experiencing high levels of social exhaustion during group activities due to sensory overload in noisy, unmanaged spaces.
By adjusting physical learning environments, creating quiet zones, and coaching teachers on inclusive group dynamics, the school saw a dramatic decrease in absenteeism and a marked improvement in overall student well-being.
None of these improvements would have surfaced through traditional test score analysis.
There are good reasons to question this approach based exclusively on standardized tests, given that real-world cases demonstrate that attentive listening and the collection of qualitative data create educational environments that are vastly more effective and humane.
How Can School Leadership Begin the Transformation Today?
Shifting an educational culture requires intentional leadership and manageable steps.
Transitioning away from an over-reliance on standardized metrics does not mean abandoning accountability; rather, it means adopting a richer, multi-dimensional definition of accountability.
First, school leaders should audit their existing data collection habits. Most schools already collect vast amounts of information, but very little of it examines social dynamics, student agency, or daily accessibility friction.
Re-allocating time toward climate surveys, narrative teacher evaluations, and student portfolios provides a comprehensive picture of institutional health.
Second, professional development must shift from basic compliance training to practical relational pedagogy.
Teachers need time, resources, and encouragement to foster inclusive group dynamics, design multi-modal assessments, and build peer-support systems within their classrooms.
Finally, school boards and policymakers must broaden their definition of success.
When district evaluations celebrate schools for building strong, compassionate, and accessible communities alongside academic growth, educational institutions will finally have the freedom to measure what truly matters.
Frequently Asked Questions
Why aren’t standardized test scores enough to evaluate school inclusion?
Standardized test scores measure academic performance under specific, highly uniform conditions.
They do not capture whether a student feels safe, valued, socially integrated, or empowered within their learning environment.
A school can have high test scores while maintaining an exclusionary or socially isolated atmosphere for disabled students.
Does measuring qualitative inclusion add excessive work for teachers?
Not when integrated into existing routines. Simple tools like bi-weekly digital check-ins, brief observational rubrics during group work, and student-led goal portfolios can be embedded naturally into normal classroom activities without overwhelming educators with administrative overhead.
Can qualitative metrics of inclusion be objective and reliable?
Yes. When qualitative metrics use standardized observational rubrics, consistent climate surveys, and clear behavioral indicators, they yield reliable trend data over time.
Objectivity in social sciences comes from systematic, repeated observation, not just from numerical test scores.
How do policy makers view non-test metrics for school performance?
There is a growing global movement among educational researchers, policymakers, and advocacy groups toward multi-metric accountability frameworks.
While standardized testing remains common, many regions are adopting school climate surveys, social-emotional well-being indices, and accessibility audits as formal components of institutional evaluation.
